 Why Analytics Matter
By Logicbroker | May 23, 2019
Out of the box, all Logicbroker customers have access to report visuals. These provide a view of both company and partner performance. By default, there are three dashboard views that can be used as-is or as template to edit and customize.
The Logicbroker team has been heavily invested on delivering analytics and reporting to our users, as we collect robust data and believe this data is beneficial for our users to run more efficient businesses. In particular, we’ve selected the top three benefits of leveraging Logicbroker Analytics.
Monitor Partners
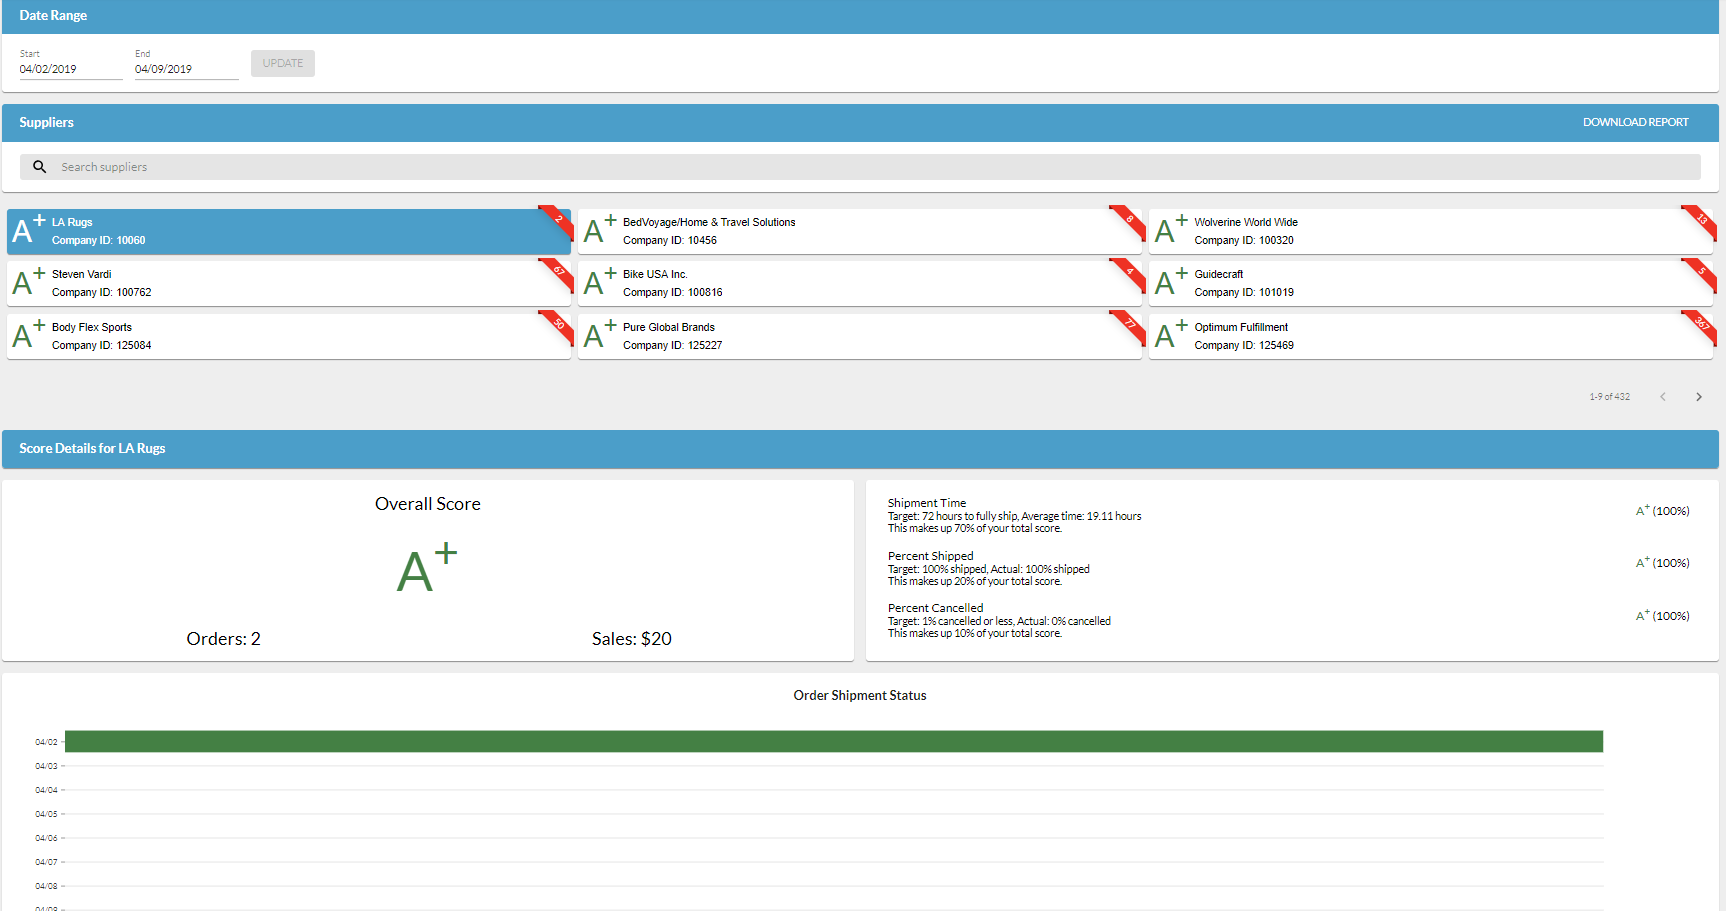
Viewing the Partner Dashboard enables users to drill down on specific partners. Alternately, an aggregated 
Demand Planning
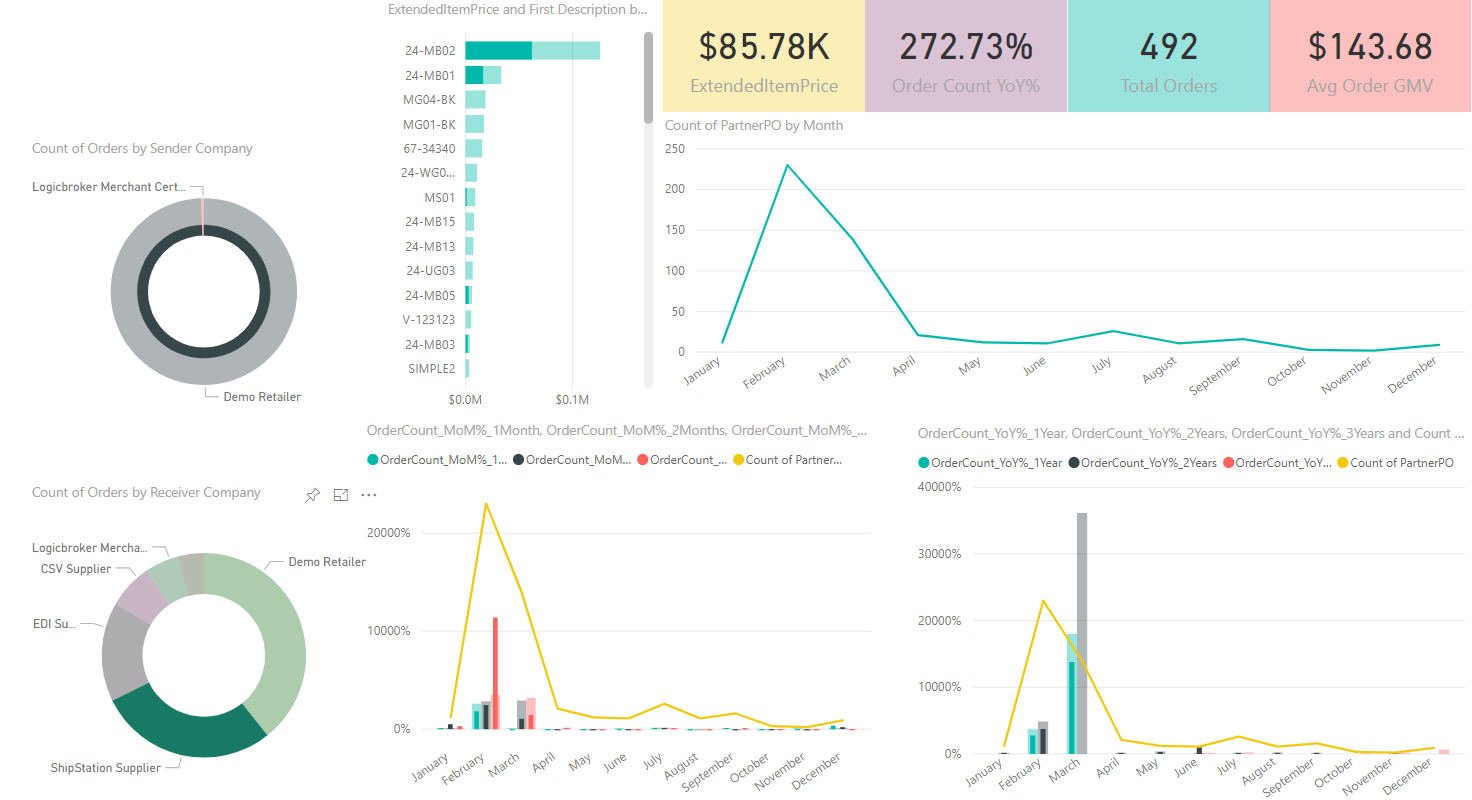
Forecasting stock is a critical component to successful supply chain planning. Analytics showcase order data so it is easy to track YOY demand and any outlying spikes so that you can weave in a shift in demand and better predict stock increases or decreases. Data analytics can help forecast accuracy and minimize the likelihood of out-of-stock items. It is important to match any outlying increase or decrease in demand with marketing activities, seasonal demand, and publicity to better explain the data as well.
Track Growth
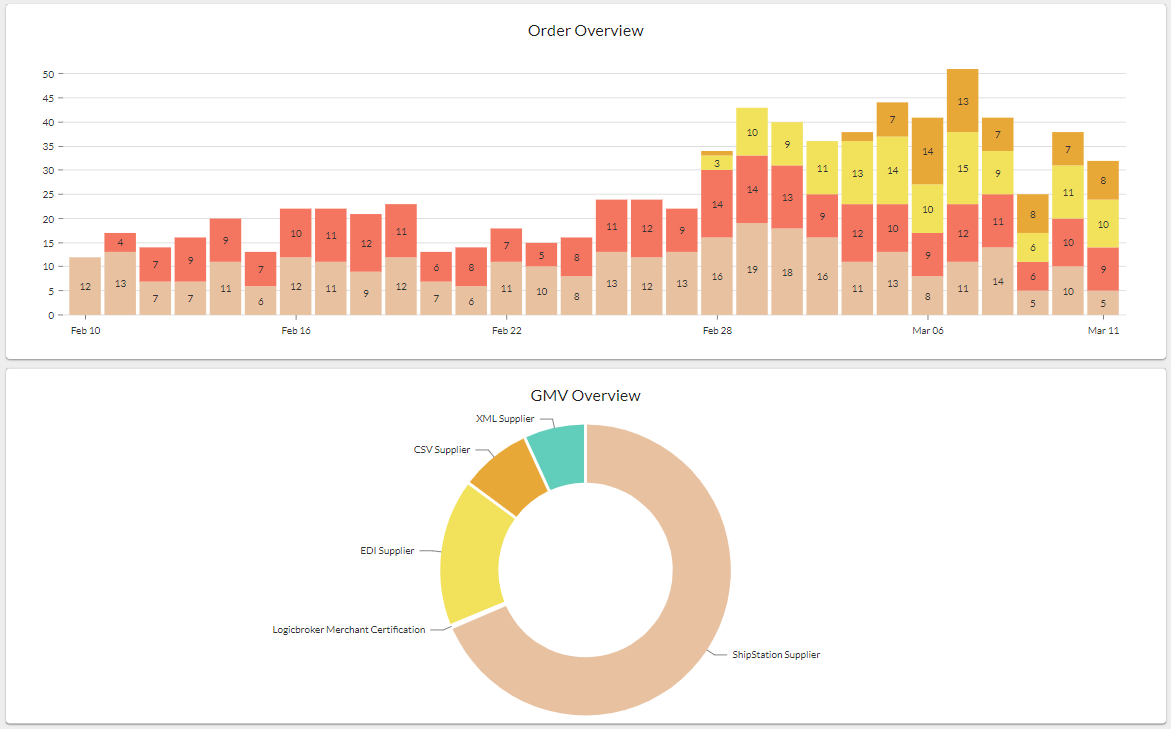
When reviewing default reports, navigate to the overview page to see the performance, view partner 
Beyond our out-of-the-box capabilities, Logicbroker customers can elect to upgrade to advanced analytics and have full access to our data set, hosted independently in our reporting server. Advanced analytics enable the creation of custom reports, including bar, line, area, pie, tables, etc., including full business intelligence (BI) reporting for all data on our platform. To add advanced analytics access to your account, please contact us.
Modern dropship & marketplace solutions have never been so easy.
Are you ready to drive growth and gain unparalleled speed to market with a modern, scalable dropship or marketplace program? Fill out the form below to get in touch with our team:
